
Dataset Source: https://www.kaggle.com/russellyates88/suicide-rates-overview-1985-to-2016/downloads/suicide-rates-overview-1985-to-2016.zip/1
Tools used for Analysis : Rstudio, Excel
Generation with most suicides (1985-2016)
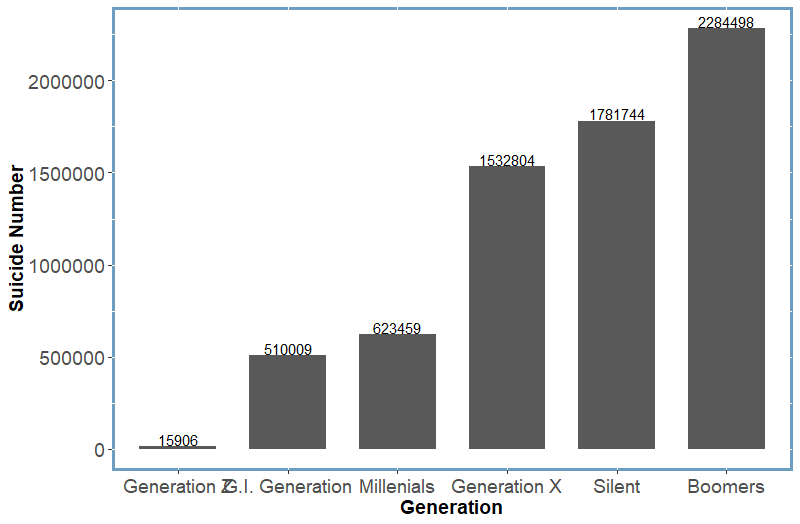
| Boomers (25-34 years) | 2,284,498 |
| Silent (35-54 years) | 1,781,744 |
| Generation X (15-24 years) | 1,532,804 |
| Millenials (15-24 years) | 6,23,459 |
| G.I. Generation (75+ years) | 510,009 |
| Generation Z (5-14 years) | 15,906 |
The above chart and table shows the overall suicides grouped into generations. Boomers has the highest number recorded suicide.
Suicide count on the basis of Gender
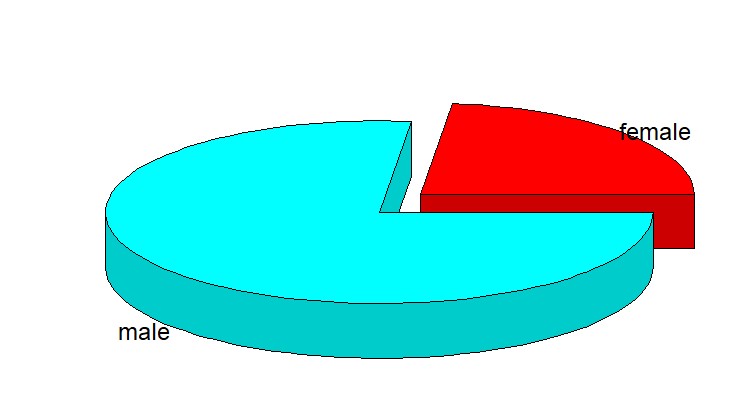
| Male |
5,188,910 |
|
Female
|
1,559,510
|
Highest Rate of Suicide on the basis of Countries

| Countries | Suicide Rate (per 100K population)* |
| Lithuania | 40.41557 |
| Sri Lanka | 35.29515 |
| Russian Federation | 34.89238 |
| Hungary | 32.76152 |
| Belarus | 31.07591 |
| Kazakhstan | 30.51128 |
| Latvia | 29.25933 |
| Slovenia | 27.82786 |
| Estonia | 27.2769 |
| Ukraine | 26.58232 |
*Obtained by calculating the mean of suicide rates of every year.
Countries with Lowest Rate of Suicide

| Country | Suicide Rate (per 100K population) |
| Jamaica | 0.5217647 |
| Antigua and Barbuda | 0.5529012 |
| Oman | 0.7361111 |
| South Africa | 0.9645417 |
| Kuwait | 1.1864333 |
| Bahamas | 1.2473913 |
| United Arab Emirates | 1.3179167 |
| Maldives | 1.3673333 |
| Qatar | 1.7873596 |
| Bahrain | 1.854127 |
*Obtained by calculating the mean of suicide rates of every year.
Correlation Test between Suicide Rate and GDP per capita of the Country
Pearson’s product-moment correlation
t = 0.29774, df = 27818, p-value = 0.7659
sample estimates:
Corrrelation : 0.001785134
Therefore, it’s clear that GDP is not significantly correlated with Suicide rates.
